미국·해외주식

What Are the Key Technical Signals for XLB Performance?
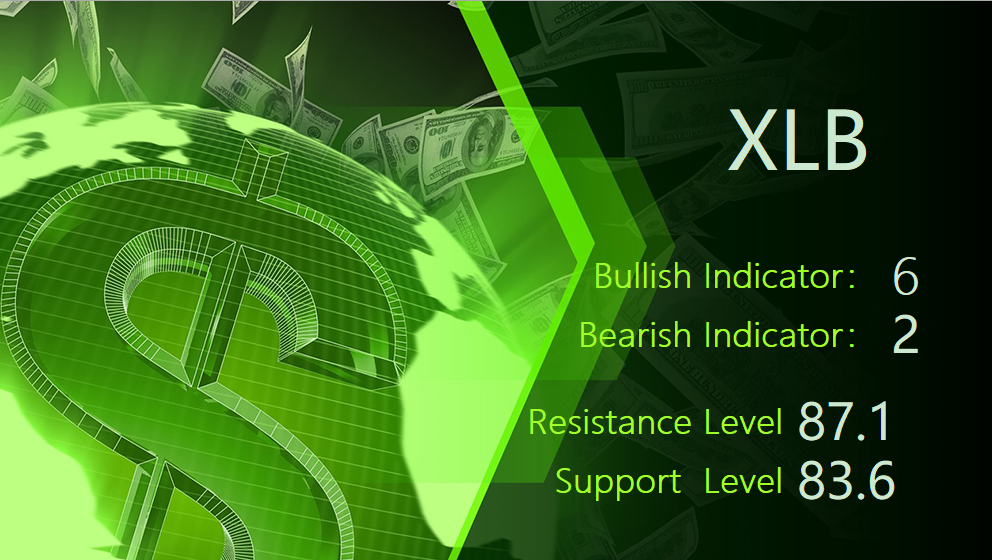
Trend Outlook $XLB XLB has a 42.0%probability of rising stock price. When the probability of rising is lower than 50%, it means that the probability of falling is relatively high; if the probability of rising is higher than 50%, it means that the probability of stock rising is relatively high. Combining multiple technical analysis indicators, XLB has 6 bullish signals and 2 bearish signals. XLB's short-term support level is 83.6. If it falls below 83.6 during the session, it will have a chance to test 81.5 . XLB's short-term resistance level is 87.1. If it breaks through 87.1 during the session, it will look up to 87.6 .ETF,XLB,technical_analysis,support_level,resistance_level,upside_probability